
Part 1: The National Landscape and Trends Across the Country
Ever since 2016, politics has continued to attract more national attention with much more posturing from both Democrats and Republicans. Even before former President Trump entered politics, political fundraising was dramatically increasing, highlighted by former President Obama’s incredible fundraising records set in 2008. Midterms usually do not garner as much attention or contributions; however, 2018 bucked this trend, surpassing the presidential election cycle of 2016. In 2020, fundraising shattered all historical norms as contributions dramatically surpassed records for both parties.
Why does this matter? Since 2000, we have seen that candidates who spend the most win 70%+ of the time, regardless of the House or the Senate. In fact, the top 50 individual donors donated more than $1 billion in 2022. As of late November 2022, the midterm elections are mostly behind us, with some race results still unresolved. Candidates who outspent their opponent surpassed 90% for the first time in both chambers, with one Senate race still unresolved.
Windfall is a people intelligence and AI company that helps more than 800+ organizations become more data-driven. Given our unique data perspective, we wanted to tackle (1) how fundraising evolved over the last several election cycles and (2) where this money is coming from. We have previously written about similar trends in the 2018 and 2020 election cycle; however, for this cycle, we wanted to break this into a three-part series that focuses on:
- The national landscape and trends across the country
- The impact of high net worth households across political contributions
- Key races impacted by large political contributions
For Windfall’s analysis, the underlying data in these posts are filtered for individual contributions made directly to candidates, parties, and committees linked to candidates reported through October 31, 2022. Contributions from organizations, as well as donations made to unaffiliated PACs, were excluded.
We will be focusing on #1 for this blog post with the additional analyses coming out over the next few days.
Fundraising Trends Over Time
As indicated earlier, political contributions have ballooned over the past 4 years. To help us gain a foundation of understanding the overall landscape, we look holistically at all individual contributions over the past 15 years. As expected, this analysis demonstrates a consistent trend of growing contributions peaking as we get closer to Election Day in November.
Total Donations by All Parties
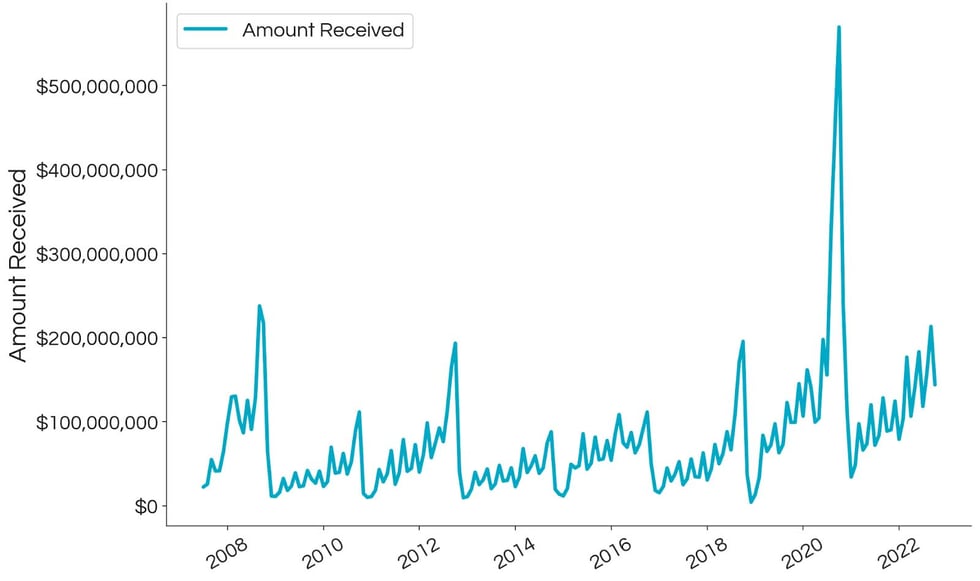
As we wrote in our 2020 analysis, 2018 stands out as an anomaly across midterm election cycles. 2018 saw similar fundraising thresholds as presidential elections in 2008 and 2012, and even surpassed 2016 contributions. This has been attributed to “the Trump effect,” which characterizes a supercharged political environment since early in Donald Trump’s presidency. In 2020, we can see just how much this effect dwarfed historical elections.
As a reminder, as we look to 2022, our data goes through October. We will, if historical trends persist, see individual contributions catapult through November as with the last 7 election cycles. If we just look at an apples-to-apples comparison of January through October of 2018 versus 2022, we can see some of the underlying shifts. Specifically, during that same time period, 2022 political contributions have increased nearly 69%, while the number of individual donors has actually decreased by ~17%. This means fewer donors are contributing much higher amounts, which signals that the political climate remains heightened even under the Biden Administration.
While the analysis above focused on all parties, we wanted to zoom in on the two major parties in the United States: Democrats and Republicans. Since both parties receive the majority of the contributions, the trend remains, although showcasing that the majority of fundraising over the past 3 cycles favors Democrats over Republicans.
Total Donations by Party
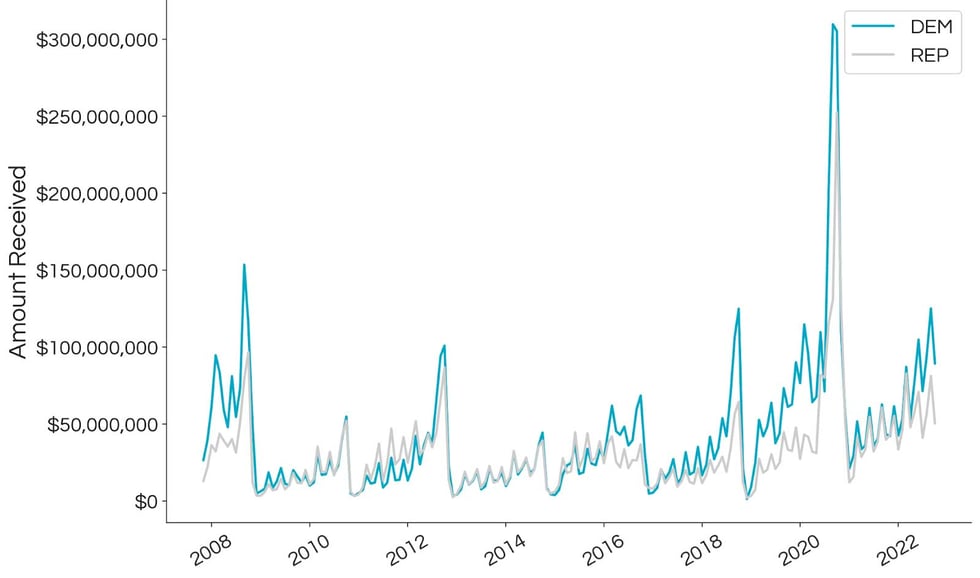
Just by looking at these trends, it seems like the escalation of political contributions is here to stay with 2022 approaching record-breaking midterm fundraising totals for both parties. Were there more races to contribute to? Was this driving the overall contributions? Windfall looked into high-profile Senate races, and in fact, there were the same number of seats (35) available in both 2018 and 2022. That being said, these races are for different candidates and we’ll explore the impact on battleground states later in this series.
In-state vs. Out-of-state Contributions
Midterm elections are particularly interesting in that all candidates running represent constituents of a particular state/district, versus presidential candidates who will represent the entire nation. That being said, those candidates in “purple” states at times can outweigh their influence, especially with razor-thin margins in Congress. Whether it is in battleground states or battleground races, candidates can draw from a larger national donor base to bolster their efforts.
Windfall first analyzed the total dollars that states received from across state borders, regardless of political party. Some states like Georgia, Pennsylvania, and Nevada received some of the highest contributions, which showcase their importance in the overall election cycle. That being said, California, somewhat surprisingly, is also one of the largest recipients of out-of-state contributions.
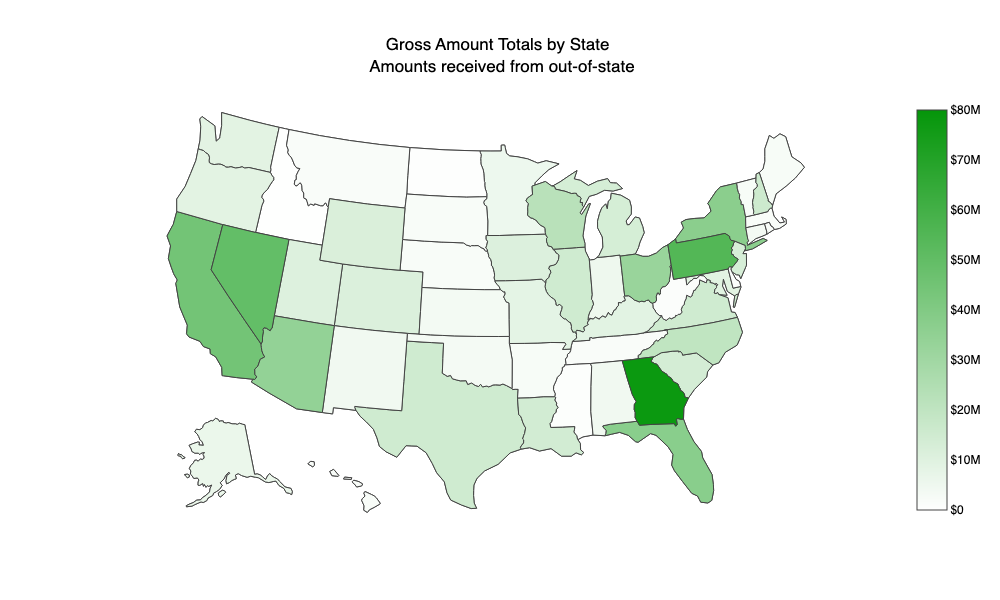 Of course, California is one of the most populous states with the most races in the country and also houses two of the top fundraising politicians: Nancy Pelosi (D) and Kevin McCarthy (R). So while that may make sense on the surface, Windfall wanted to understand a bit more about how out-of-state dollars may have impacted local constituent fundraising. To analyze this, we looked at the ratio of out-of-state contributions versus in-state contributions.
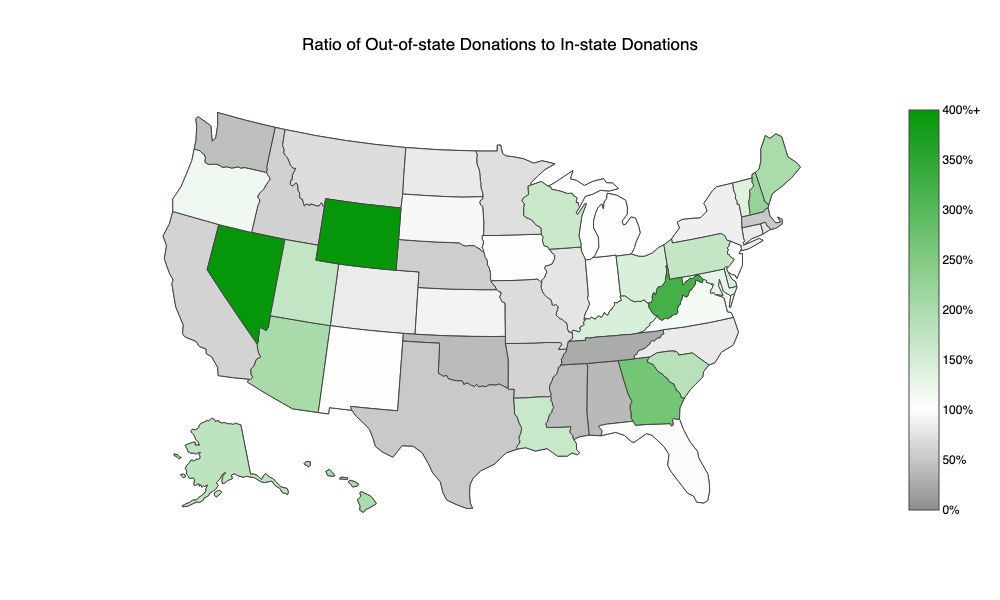 In this graph, we can now see that California normalizes and in-state donors actually contribute much more than out-of-state counterparts. Other key battleground states like Georgia and Nevada still have a disproportionate amount of out-of-state contributions. Some other states, while low dollar totals, also appear to pop like Wyoming, which had an 8.6x out-of-state to in-state contributions that can somewhat be attributed to Liz Cheney’s loss to Trump-backed Harriet Hageman. If we look at the top 10 states that received out-of-state contributions, it either speaks to smaller constituencies for various states or key battleground contests:
What About Republicans and Democrats?
We also had the question about the influence of out-of-state contributions for Democrats versus Republicans. Specifically, where are we seeing the most impact? For the benefit of the analysis, we have put together a matrix to showcase Democrats versus Republicans for (1) total out-of-state contributions and (2) out-of-state versus in-state contributions.
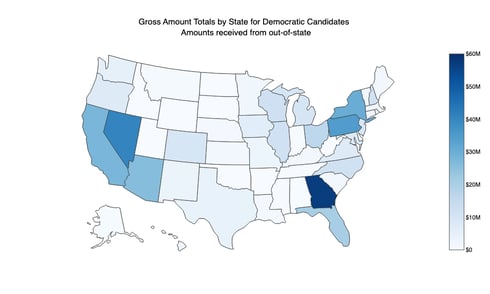
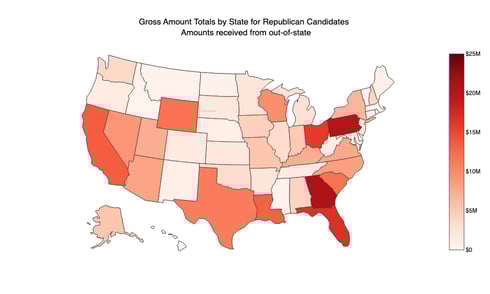
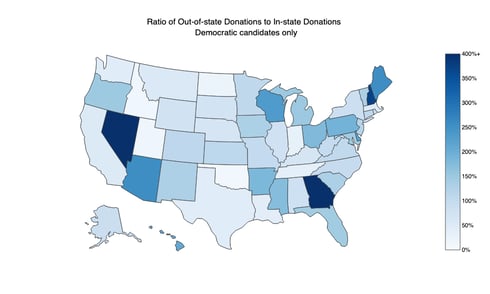
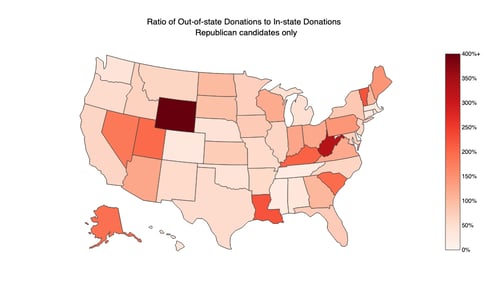
Some interesting highlights include the out-of-state ratio for Georgia, where Democrats have a 6.2x ratio of out-of-state contributions versus Republicans 1.1x. Both parties had more out-of-state donors than in-state donors; however, Democrats saw dramatically more donors (~5x) than their Republican counterparts. Generally, across most states, Democrats saw a higher ratio than Republicans.
To further our analysis of total out-of-state donors, we wanted to understand this impact. For clarity, this analysis shows the number of out-of-state donors that gave to a race in that state. Thus, a donor could be duplicated if you gave to multiple out-of-state races.
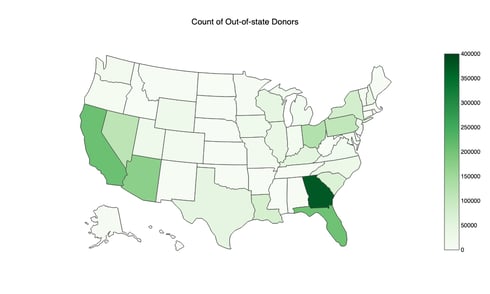
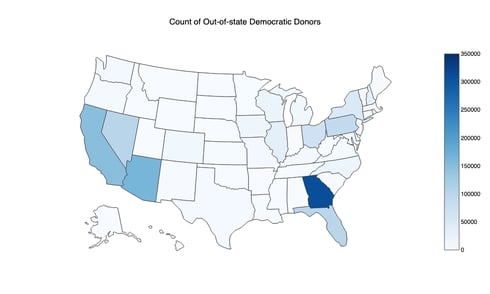
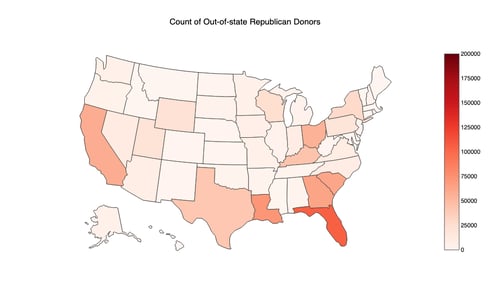
On the surface, it looks fairly similar with Georgia still being one of the hotly contested states for both parties. That being said, it is interesting to point out how some donors were attracted to certain states like Florida, where Republicans saw an influx of out-of-state donors most likely supporting Governor Ron DeSantis’ reelection.
If we look closely though, we can see that most states are seeing much more balance of out-of-state donors. The graphs do not significantly highlight the key battleground states, thus showing that the dollars are being donated disproportionately by donors.
To understand who is providing these contributions and their influence across state lines, we wanted to take a closer look at high net worth donors in this election cycle. We’ll be tackling this topic in our next blog post. In the meantime, subscribe to our blog for future data-driven insights of interest today!
If you’d like to learn more about how Windfall’s understanding of people data can take your organization to the next level, please reach out to the Windfall team.
Sources & Footnotes:
(1): OpenSecrets.org: Did Money Win? Accessed on November 24, 2022.
(2): The Washington Post: Meet the Mega Donors Pumping Millions into the 2022 Midterms. Accessed October 29, 2022.
(3) FEC reporting does have delays in reporting all contributions through this date.
This article was written by Windfall’s Arup Banerjee, CEO and Co-founder, Christa Hammond, Director of Data Science, and David Schemitsch, Senior Data Scientist, using a combination of FEC and Windfall’s data.
About Windfall
Windfall is a people intelligence and AI company that gives go-to-market teams actionable insights. By democratizing access to people data, organizations can intelligently prioritize go-to-market resources to drive greater business outcomes. Powered by best-in-class machine learning and propensity modeling, Windfall activates insights into workflows that engage the right people for each respective organization. More than 800 data-driven organizations use Windfall to power their business.